The latest COVID-19 data for Advocacy Summit host community - Houston, Texas

by: Jack Johnson, Destinations International
The following is the latest COVID-19 data for Harris County, Texas including the City of Houston – the site of the Advocacy Summit, Funding Forum and CDME. We will update this information again next Monday.
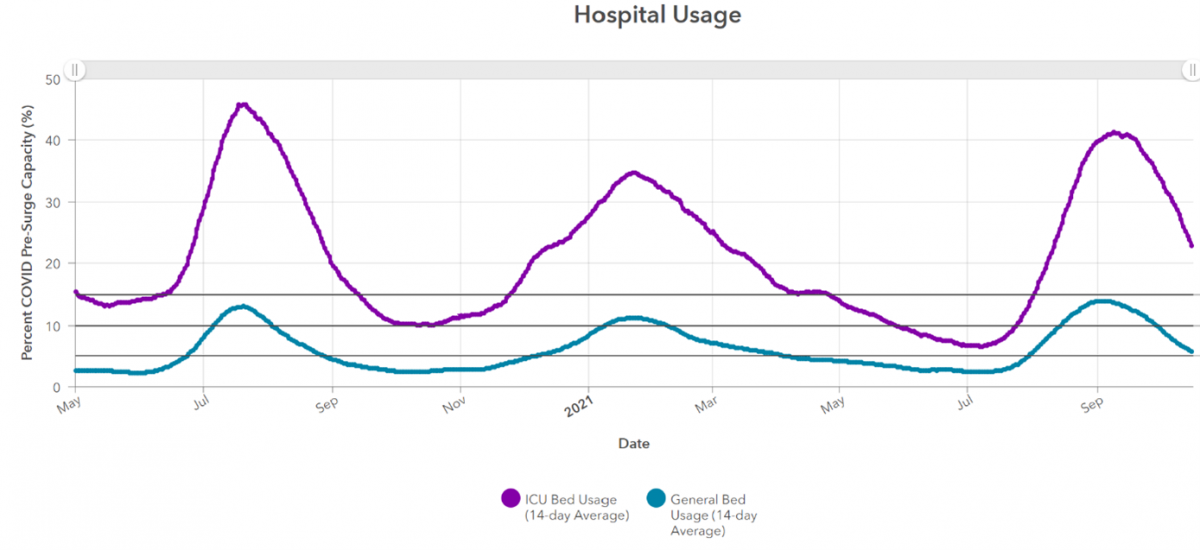
Let’s start with the latest information on hospital bed usage. The ICU and general population hospital beds in use is an important indicator for communities in the battle against the pandemic. The news here is good.
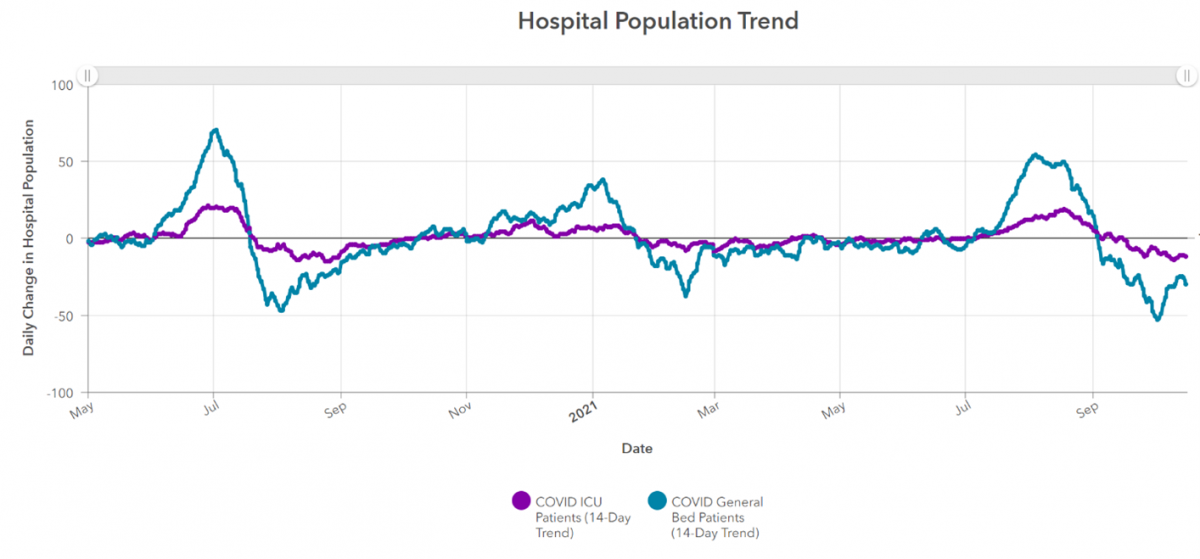
Harris County monitors day-to-day trends, and the 14-day average of ICU and general population hospital beds in use in Harris County (including City of Houston) is reported daily. According to information uploaded October 18th, ICU Bed Usage is at 22.84% (still too high for comfort but less than the 50% during the height of the first wave) and General Bed Usage is at 5.72%. These numbers represent a reduction of 12.52% and 29.8% respectively. Numbers have been on a steady decrease since highs on September 19th and 4th respectively.
Next, let’s look at daily new cases. The number of daily new cases is an important indicator of the success of social distancing measures, face covering, and other preventative measures. Although testing availability can affect the reliability of new case information, it is still considered an early indicator of progress. Here again, the news is good.
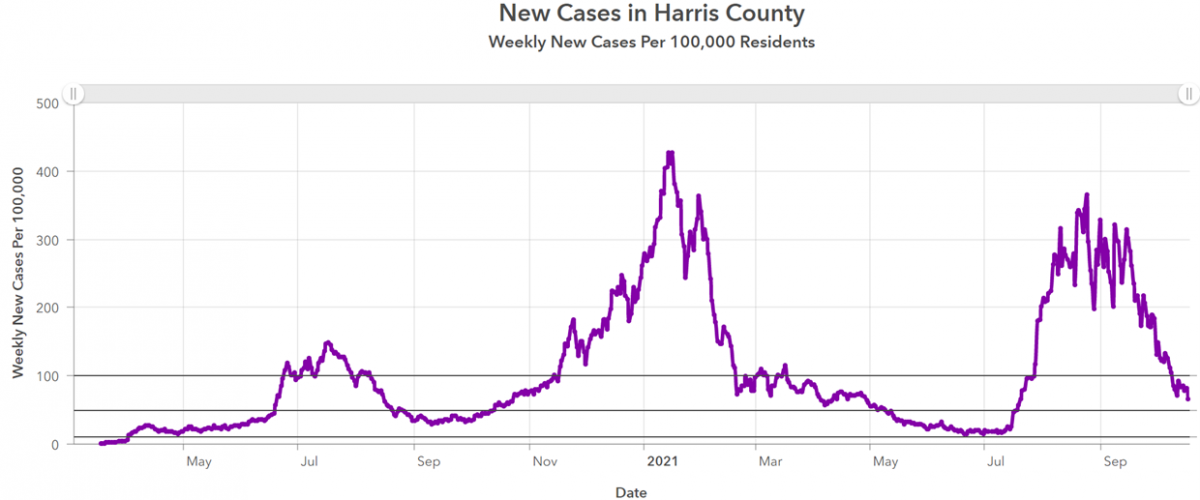
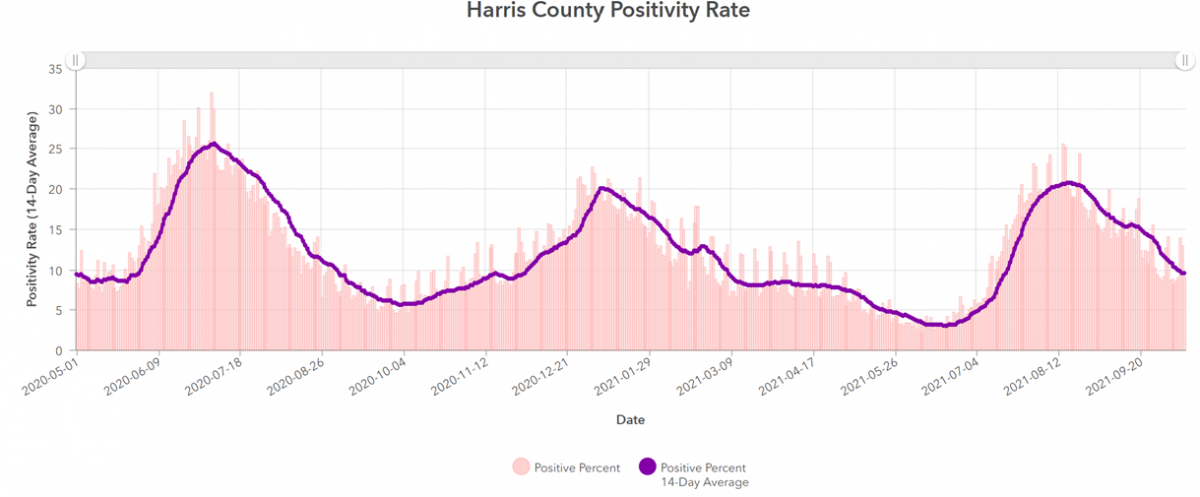
The 7-day average of new cases is 66.34 per 100,000. Again, still higher than anyone would like but this number is part of a continuing downward trend. Testing positivity rate is a secondary indicator and is no longer used to indicate progress or the spread of COVID-19 in most communities. However, Harris County Public Health and partnering organizations will continue to monitor and report on this information. As you can see on the chart below, the trend line is good here also.
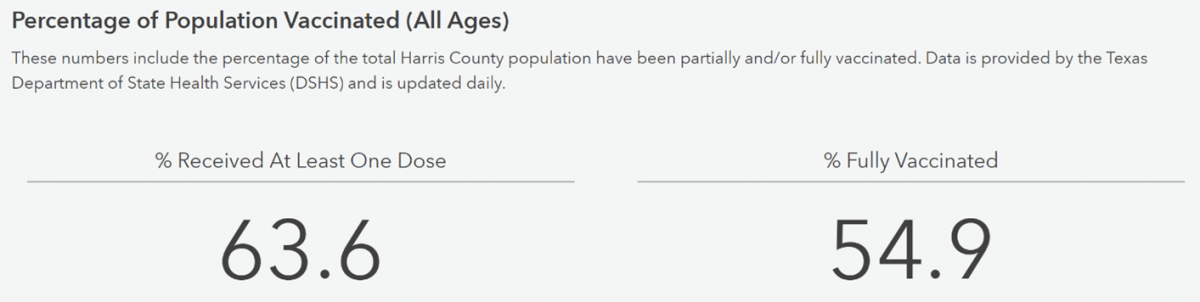
Finally, let’s look at the vaccine numbers. Please note that due to availability of resources, this data has recently been reported between 2 to 3 weeks behind. This means that the number of doses administered is likely higher than what is reported here. Harris County Public Health (HCPH) is actively working with the State to receive more timely information.

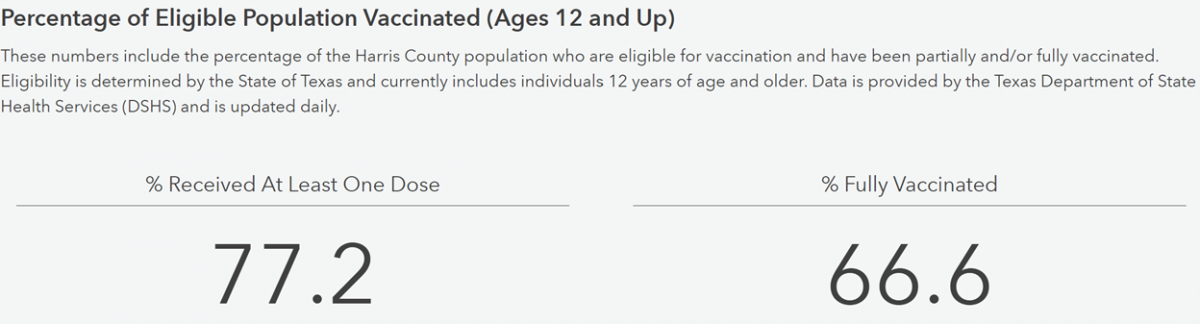
Please note that only approximately a little more than 83% of the Texas population is eligible to be vaccinated at this time. I do not know that number for Harris County.
While these numbers may not be as low (or high depending on the stat) as we would like, it does show that the response of Harris County, Texas and the city of Houston is working. To view this and additional data, please visit the Harris County / City of Houston COVID-19 Data Hub.
We hope to see you at the Advocacy Summit, Funding Forum and CDME in Houston.