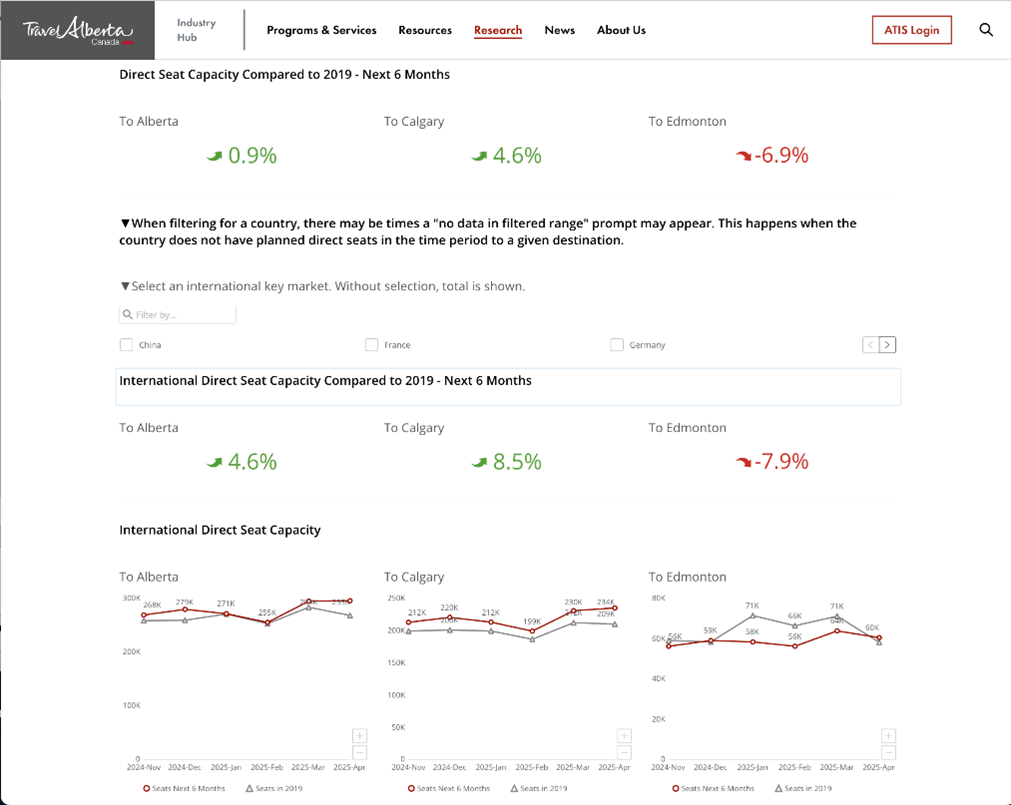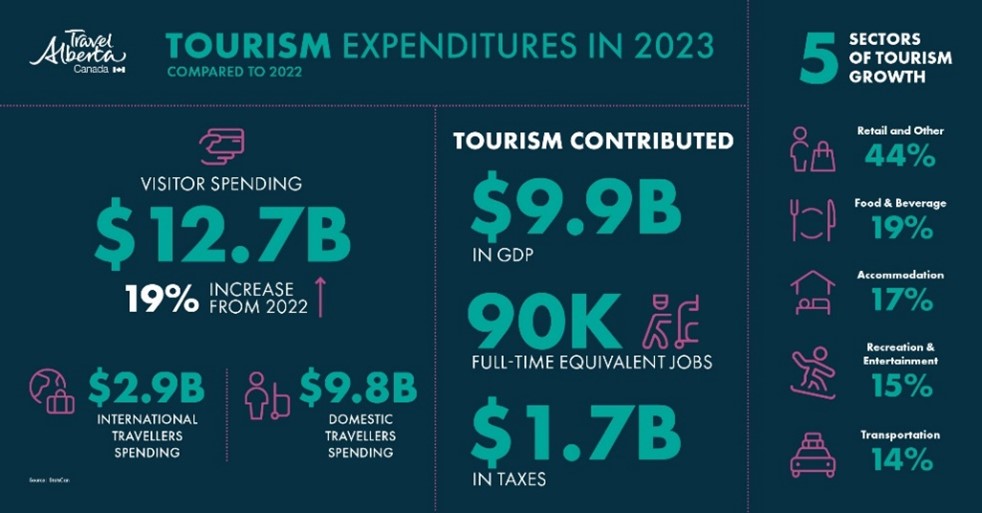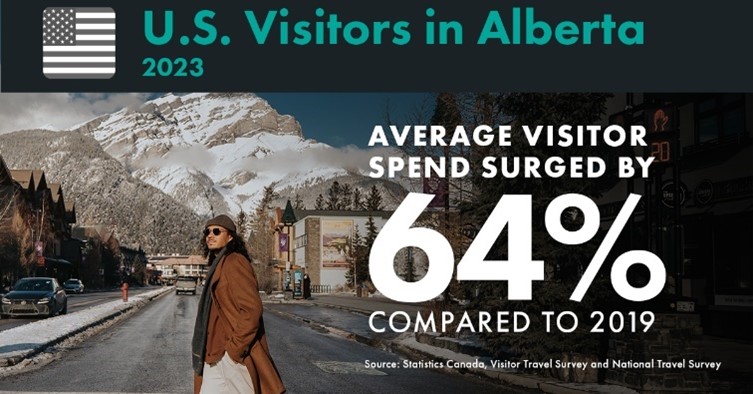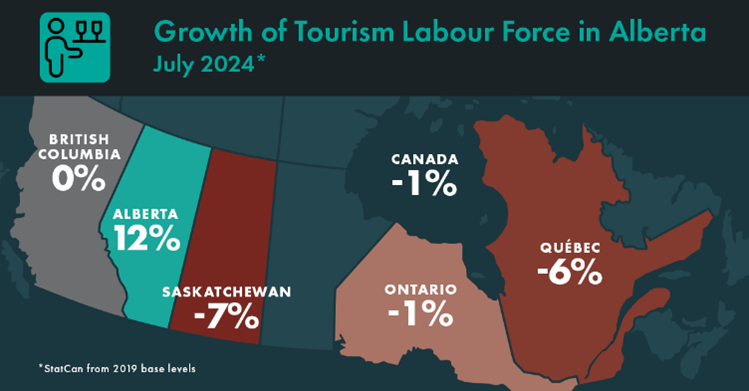
Travel Alberta is making data more accessible to Alberta’s tourism sector through its “Tourism Indicators” dashboards—interactive webpages that provide a holistic snapshot of key tourism insights, including air access trends, economic impact, visitor and market intelligence, and other indicators.
Though global tourism demand is exponentially growing, many destination organizations face regular existential threats as key stakeholders ask, “Where is all the money going? And is growing our visitor economy actually worth the investment?”
Travel Alberta’s “Tourism Indicators” dashboards make it easier to address these concerns. The interactive webpages were created in collaboration with industry to create consistent and actionable data, from a wide range of sources, all in one place. They provide a holistic snapshot of key tourism insights, including air trends, economic impact, and visitor and market intelligence.
The data can be used to inform business strategy and help build advocacy cases by demonstrating the tangible return on investment in the tourism sector, while also providing insights into market trends that can help small businesses make smarter decisions.
Travel Alberta’s executive director of planning and reporting, Marney St. John, explains how they brought this project to life.

The Inspiration
“In 2021, to support tourism recovery following the COVID-19 pandemic, the Government of Alberta expanded our mandate from destination marketing to encompass all aspects of the visitor economy: destination development, air access expansion, strategic marketing, and investment attraction. We couldn’t just focus on bringing visitors here; we needed to develop tourism product that meets the evolving expectations of travellers in a competitive global market.
The idea for the dashboards naturally grew out of this new vision. We needed comprehensive, easy to understand data to inform our business strategies and demonstrate a strong return on investment to Albertans, entrepreneurs, government, and investors.
Now tourism operators and destination organizations can understand shifts in the industry, find opportunities for product development, and make strategic decisions that can strengthen their businesses for the long term. We’re also making it easier for decision-makers to understand the true value of the visitor economy, so they’re more likely to champion tourism development within their constituencies.”

Why Dashboards?
“To effectively leverage data and insights, consistency is key. And many tourism businesses are small destination organizations or “mom-and-pop” shops that simply don’t have the resources to regularly collect and compare datasets. That’s why the dashboards work – we do the heavy lifting, providing real insights in real time (or as soon as new data becomes available).
Industry members can use the dashboards to inform their business strategies. For example:
- Understand historical demand across regions and seasons to set variable pricing, inform seasonal hiring, manage budgets, and reduce operational costs.
- Compare destination performance, including visitation, spend, and average daily room rate with other jurisdictions across the province.
- Tailor marketing strategies to focus on high-potential markets, based on visitor origin and market size data.“
Real Insights in Real Time
“Providing everything in one place creates consistency across the entire ecosystem: large destination organizations, small businesses, and everything in-between… including our internal team at Travel Alberta.
Instead of building a separate resource for partners, we made our internal resources available on our industry website. Now, everything is in one place, so the entire sector is working from the same data… and we can all sing from the same song sheet, so to speak.
Our stakeholders love the dashboards – many wouldn’t be able to access this level of data independently. We’ve built a foundation that supports Alberta’s tourism industry well-informed, data-driven decisions that ultimately benefit the entire industry.”
Getting Technical
“Any destination can create a data-sharing program, but it takes collaboration with many partners to create something that partners will actually use.
We integrate data from public sources, including StatsCanada, Destination Canada, and Tourism HR Canada; and private third parties, including STR and Cirium. Destinations creating similar dashboards should ensure they have clear agreements with data providers and understand what information can be released online.
Creating the dashboards was just one part of the equation—we had to effectively communicate the benefits, so they didn’t just sit there on our website. We undertook user testing last year to inform usability and content improvements—and we’re continually iterating based on user feedback.
We always email our partners to let them know when new data is available and share bite-sized insights with examples of how this data might be used. Wherever possible, we also provide the ability to export as a PowerPoint, PDF, and excel.”


Making the Case for Tourism
“In today’s complex political landscape, creating the winning conditions for tourism development demands more than just investment—it requires the buy-in of diverse stakeholders and supportive policies to enable sustainable growth.
Destination organizations can help secure this buy-in by making a strong case for tourism investment, with real data to back it up. Putting in the legwork now to build trust and credibility will help address barriers to growth and catalyze sustainable, long-term tourism growth.
If you’re thinking of embarking on a similar journey, start by sitting down with key stakeholders to figure out where the gaps are. Then, build a platform that evolves alongside those needs—with real, actionable insights that will help you and your partners achieve your goals.”
Submit Your Thought Leadership

Share your thought leadership with the Destinations International team! Learn how to submit a case study, blog or other piece of content to DI.


