Positions and Positioning: A Further Dive into the Compensation and Benefits Platform


By Andreas Weissenborn, Destinations International
Kudos to many of you who read our February Impact Report and took action to fill out your latest organization info within our Compensation and Benefits Platform. Last year, there was a shift in our workforce and it is our responsibility as an industry to make sure we are benchmarking our efforts accordingly. To continue on my last blog post about the platform, I will expand on a few more to help better understand your experience as you enter your data.
Positions ≠ Job Title
Our platform is built on positions and the responsibilities of said position. Many of us have unique titles but it is about understanding the role and activities of the individual within the organization on how to select the proper position for your data entry. We currently track over 50 unique positions, with alternative titles to hopefully find one that best matches your employees.
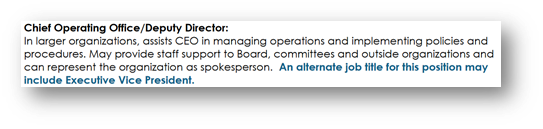
If you find yourself with a unique position that cannot find a place, let me know as I am always looking to expand our positions just as our responsibilities have also expanded in the next normal. (Check out the *Start Here* button within the platform for more descriptions.)
Headcounts
Another leaning into positions the platform wants is to separate out your total headcount for a position, or how many staff do you have in the same position. If you have multiple convention sales staff or convention services staff, you will want to make sure you indicate the total FTEs in this position within the platform.
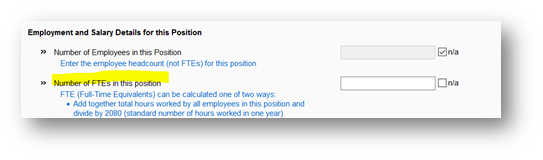
Proper headcounts are important throughout the platform as they help determine the fixed salary for the position divided by your total headcount. Many of the reports you will find throughout the platform provide this ratio so it will be important to give your accurate headcounts within.
Department Organizational Charts
Once you have hit 100% with all data entered, access to the results is instantly granted. One of the often-overlooked reports are the organization charts by departments. When you navigate to the ‘Results: By Question’ section, select the department of your choosing and select the first ‘Select Positions’ tab. Below the filters, (of which you can choose to best fit your needs) the platform will provide a percentage allocation of the positions other organizations also have as part of their staff, with your positions highlighted in blue.

In addition, make sure to click the little bar graph icon in the top right, these will then transpose this same data into a bar graph chart to export in pdf or .pptx formats for future needs.
Budgets Across the Workbook
The compensation and benefits reports has been with the trade association for decades, it is one of the longest-running research efforts and a key benefit of being a member of Destinations International. Subsequently, one of the longest formats of the data is showing it across multiple budget scenarios. This exists for you in the ‘Results: All Reports’ tab of the platform. There, scroll down to find an excel report labeled ‘Classic Salary Report.’

From here, you will see all the data from the platform across 8 different operating budget categories with their respective median quartiles.