New Insights from the Destination Organization Performance Reporting Platform

By: Stephanie Auslander, Destinations International
- Median operating budgets of destination organizations in the platform was 1,772,250 at the time of this posting
- Regarding funding, public sources of revenue comprised of 92% of revenue generated with only private at 8%
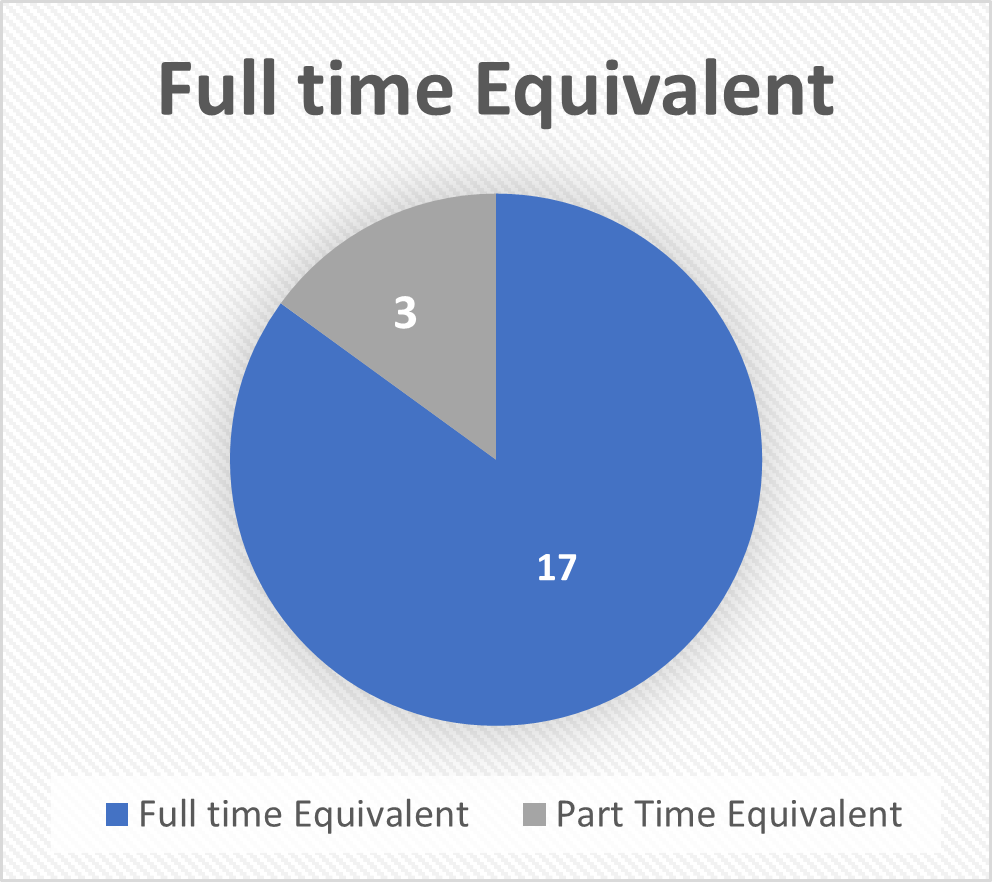
- Organizations full time equivalent median employees are 17, while part time came is 3 individuals.
- The Median occupancy taxes and/or fees on occupancy was 13%
The following content provides some key highlights at an industry-wide level.
Median Operating Budget

Public Funding Sources
Public funding remained the largest portion of revenue stream for destinations representing 92% while private funding represented 8% of all generated revenue. Below shows the breakdown of public funding through various sources including occupancy tax, sales tax, marketing, public grants, and short-term rentals.
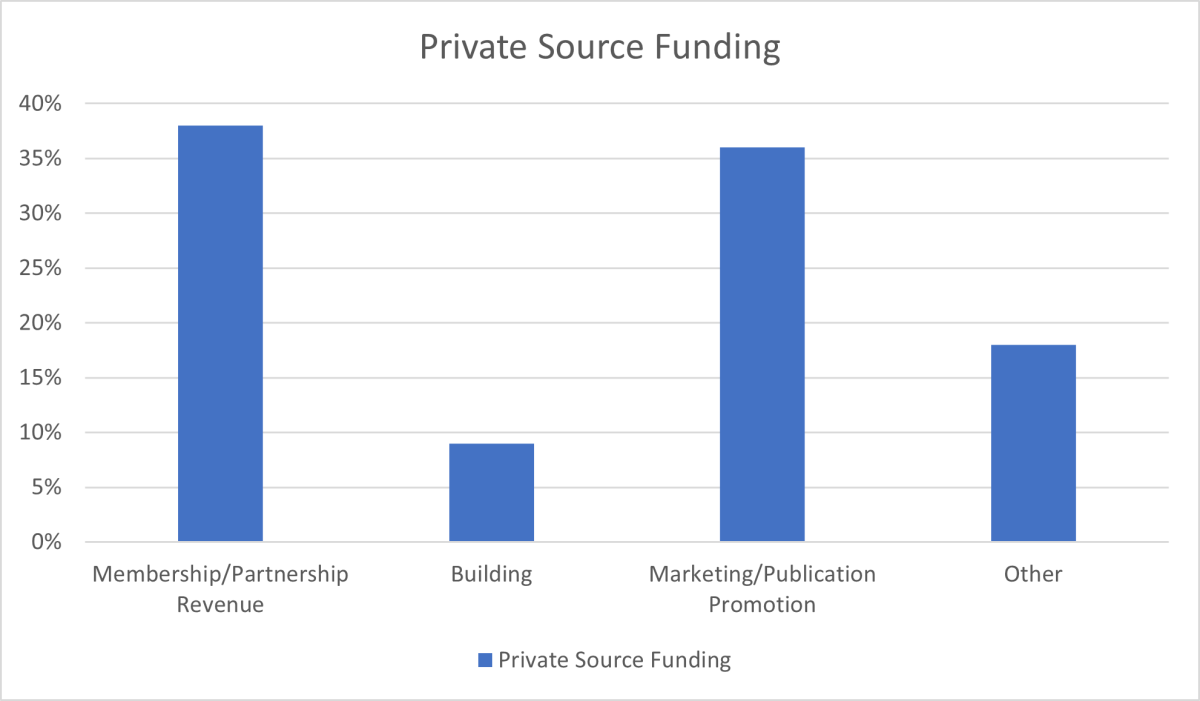
Private Funding Sources
Although only 8% of funding comes from private sources, the majority comes from membership/partnership revenue and marketing/publication promotion. Additional Sources of funding derive from private grants, service fees, and private donations.
Allocation of Destination Occupancy Tax
Convention centers and municipal general funds received the majority of tax allocations, followed by Destination Organizations.
Organization Expense Allocations
Approximately 47% of the expenses were allocated to programs, compared to 40% for personnel and 13% for general. Program expenses comprise of sales and marketing promotions, public affairs, partnership, and membership. Personnel is comprised of compensation, payroll, benefits, and administrative tasks. General expenses include expenditures on public affairs and partnership/membership.
Destination Organization Employees
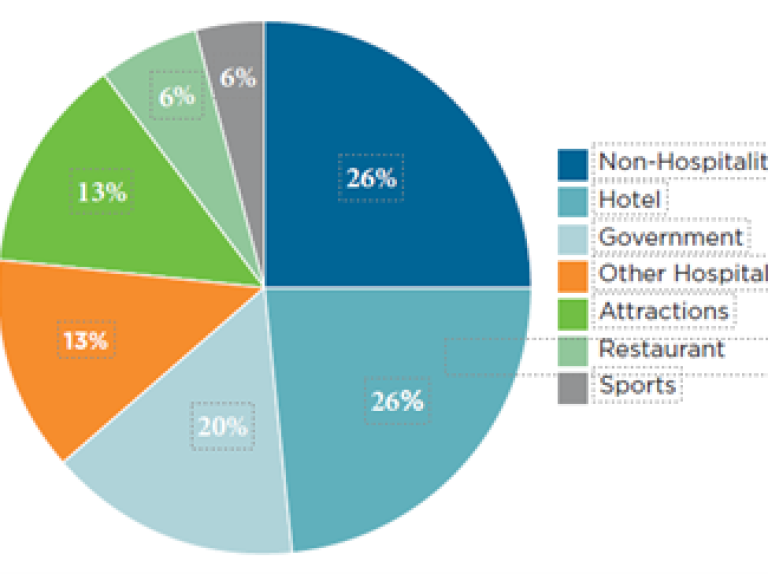
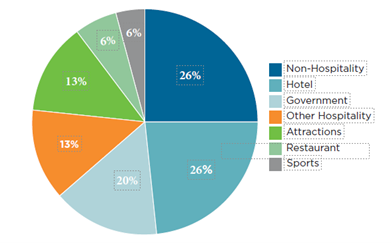
Board Compensation
Board composition of destination organization represented various sectors including hotel, government, other hospitality, attractions, restaurant, sports arenas, and non-hospitality.
Additional key industry highlights include the following as referenced in the Destination Organization Reporting Platform.
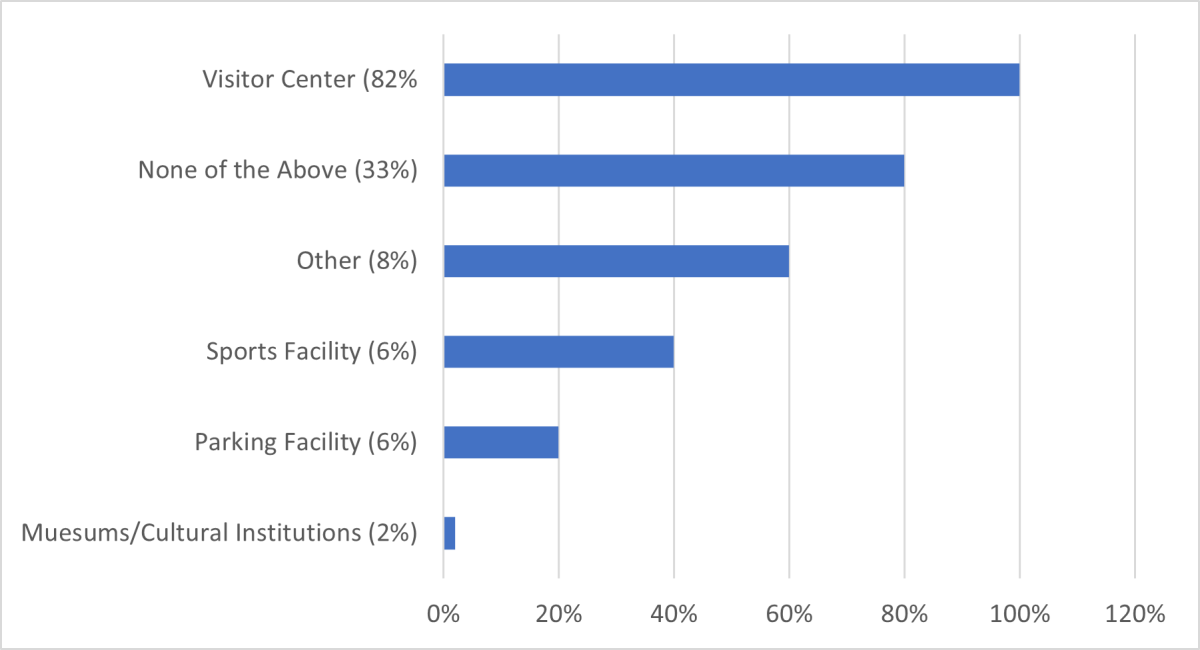
Tourism Asset Management
Another highlight from the benchmarking study details Tourism assets that are managed by a destination. Visitor centers represent the most frequent assets by our members followed by convention centers, sports facilities, museums/cultural institutions, and parking.
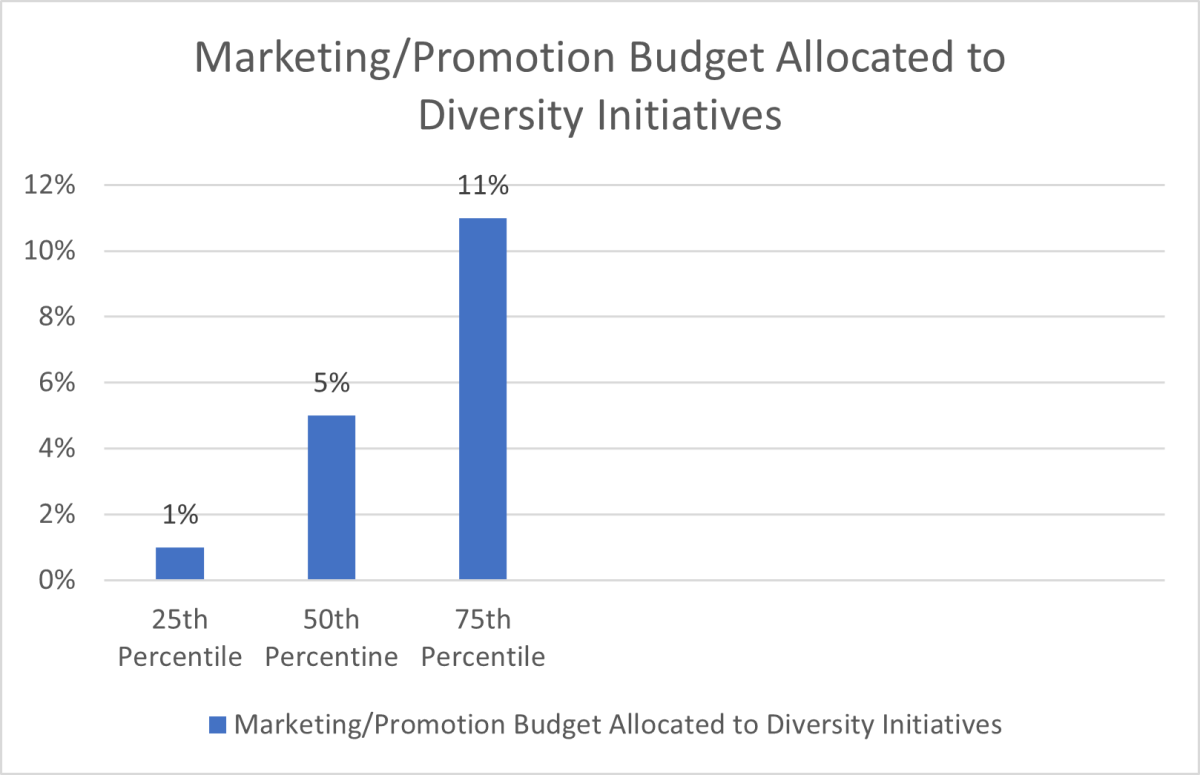
Diversity Initiatives represent more of marketing budget allocations in the profile study.
For a complete breakdown of other industry benchmarking metrics; revenues, expenses, and tax allocations we invite members of Destinations International to visit our platforms for further information.
Compensation & Benefits Platform Destination Organization Reporting Platform