A #DecadeOfData: The Event Impact Calculator at Ten Years

by: Andreas Weissenborn, Destinations International
This autumn, we’re kicking off a celebration of one of our sector’s pinnacle tools: the 10-year anniversary of the Event Impact Calculator. The tool has been with the trade association since the autumn of 2011 and is the premiere measurement of how the activities of destination organizations generate new money by procuring events. It has brought with it an arsenal of new metrics and measurements on how we talk about one of the core services we offer as destination organizations. The tool has provided a much larger canvas of data on a single event than just a single multiplier could, and allowed us to pinpoint data across event spending, taxes generated, or jobs created. All of that has given us a decade of data and we would like to share some of the trends we have seen.
![]()
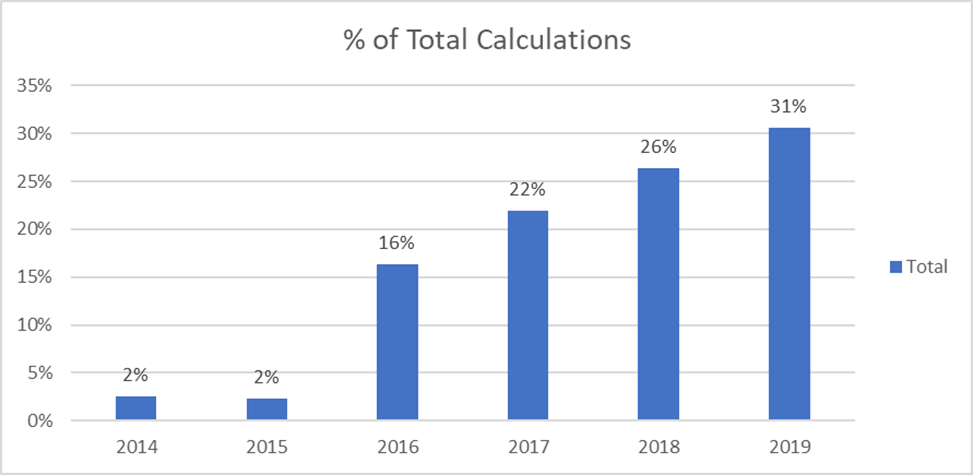
Trend 1: 2016 is when the throttle began to rev
One of the best viewpoints of a decade of data is to watch the sheer proliferation of calculations that occur every year and when that throttle really picked up in usage. The calculations by our members began slowly in the autumn of 2011; the early years represent mere single point percentages of the total calculations we are now seeing after 10 years. However, it was in 2016 that the calculations really began to take off. Almost 5 years in is when EIC usage began to go mainstream for destination organizations, a trend we saw grow each year until we hit our pandemic year.
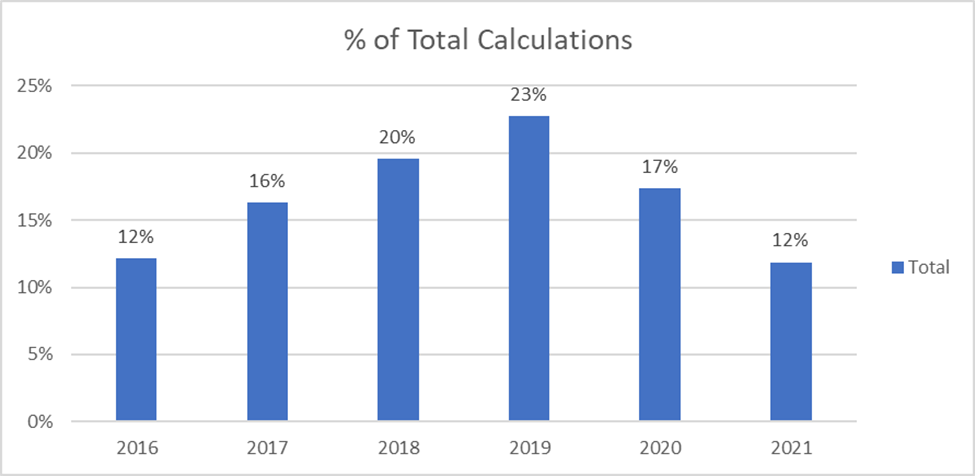
Trend 2: 2020 was the lost year
Obviously from the graph above you’re curious what 2020 looks like. 2020 did become our lost year for calculations but it's for more reasons than that. Yes, because of the pandemic, total calculations did shrink in the year 2020 but that alone is not why we will call it our ‘lost’ year. It’s also because of the sheer number of calculations being used to measure lost business for our communities because of the pandemic. Every year prior, EIC had been used to measure net new business in our destinations. The pandemic flipped that paradigm, but EIC was still the de facto tool needed to illustrate what happens when events don’t occur. This trend continues through 2021 as we see how destinations continue to evaluate new and lost business for their communities.
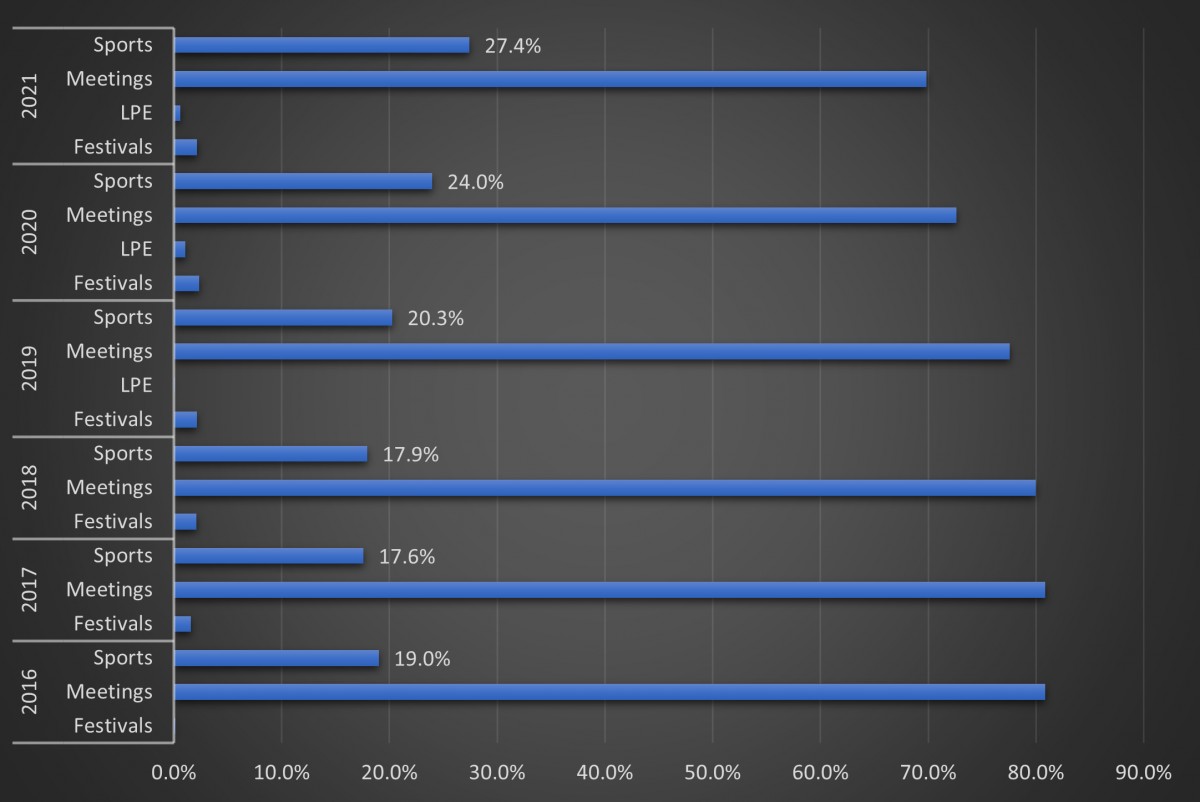
Trend 3: Growth strides, spurts, and sports
Another aspect of tremendous value is that the tool no longer comes in a single flavor but many, in the form of modules. From only offering a meetings module in the beginning, to today where we offer modules in sports, festivals, and local and public events. Given the modules have been rolled out across different years, we’re able to see adoption rates for each module by year. Looking at the same peak period of 2016-2021, it really demonstrates the proliferation of the sports module, which was the only module to increase in calculations through the pandemic. In the pandemic era of events, sports are currently demanding more of our attention in the ways they generate new money for a community.
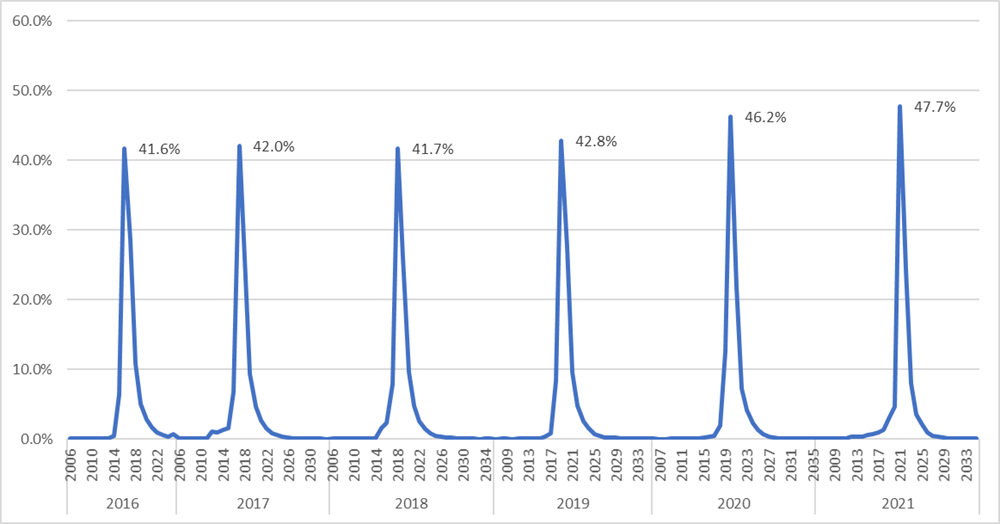
Trend 4: In the year for the year
One of the most flexible uses of the tool is the ability to measure tentative events: events your destination might currently be bidding on and you’re using the tool to evaluate what they can bring to your community. However, across our peak period of 2016-today, over 40% of all calculations are being processed for events occurring in the same year. This trend only increased through the pandemic as events are not being booked as far out and destination organizations are adapting to the next normal to evaluate any meeting, regardless of date.
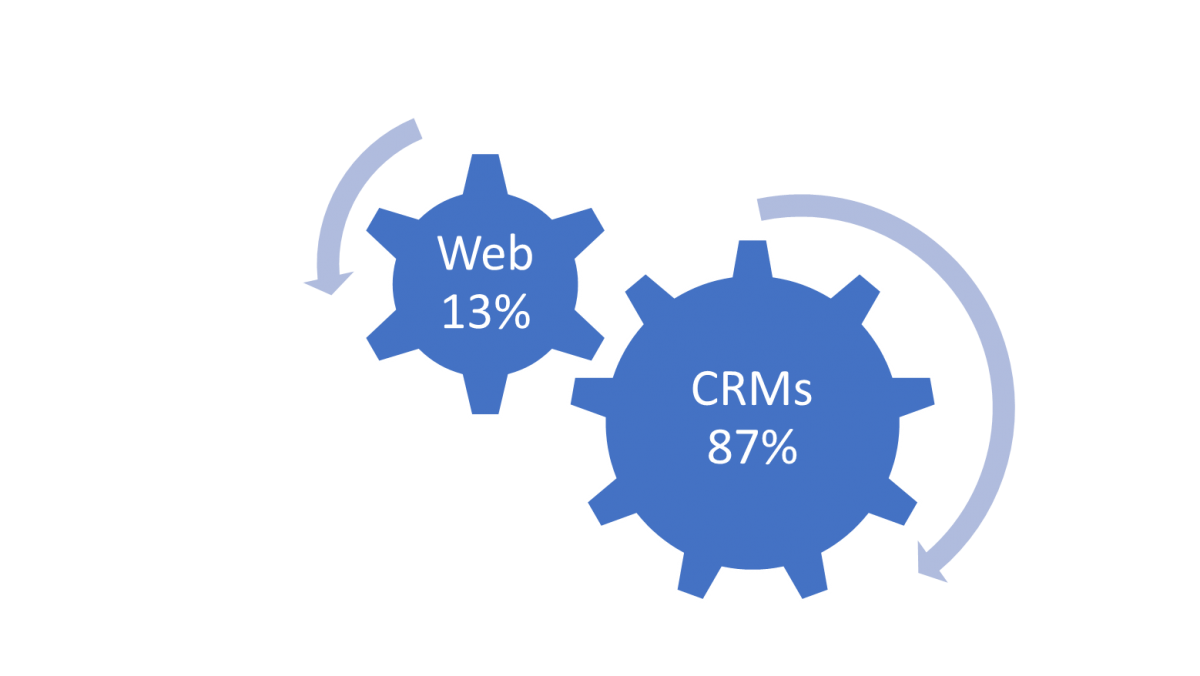
Trend 5: The power of the CRMs
And finally, this one is a tremendous thank you and nod to our CRM partners who helped us roll out the API for users of the tool to connect with their existing event data already in their CRM. Beyond just a convenience factor, this has greatly helped with speed and SOPs on delivering an accurate and timely calculation to market. Since the rollout of the API, a whopping 87% of all calculations take place within destination organizations’ respective CRMs! It truly goes to show the collaborative benefit of the EIC within our sector.
Please make sure to stay tuned through the rest of autumn as we roll out content across all our mediums in celebration of 10 years of the Event Impact Calculator with a #DecadeOfData.